
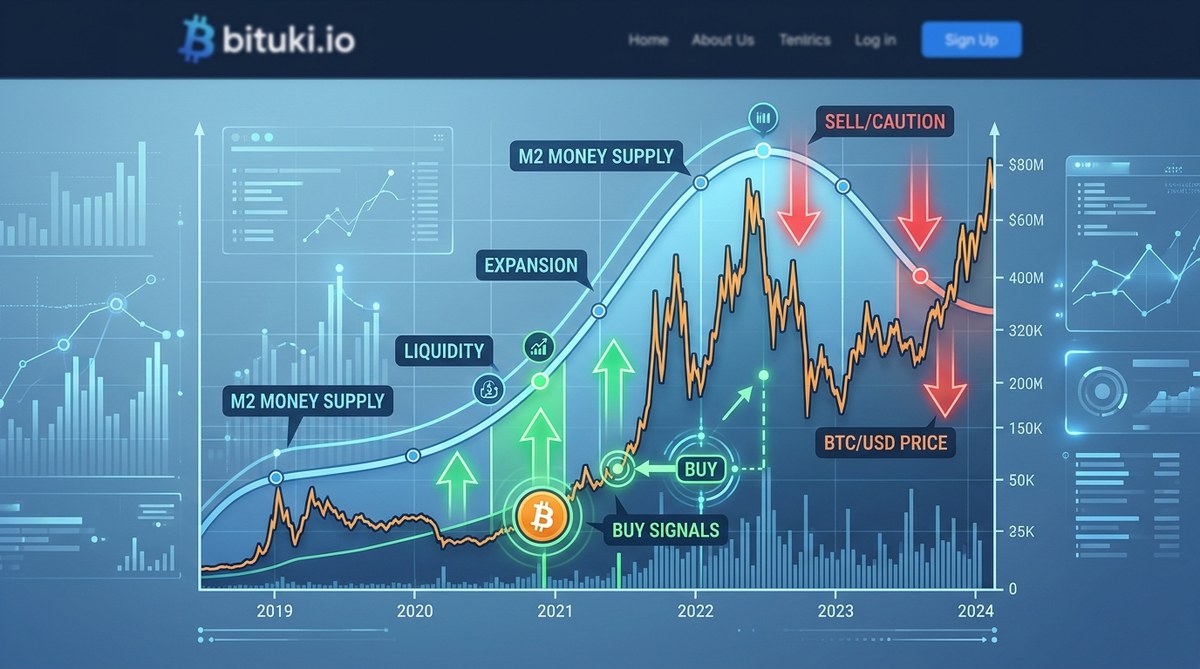
The Bitcoin M2 money supply ratio might be the most underused timing tool in crypto. You already know that Bitcoin moves in cycles. You have probably felt the frustration of buying near a local top or watching from the sidelines while liquidity flows into the market. The ratio between Bitcoin’s market cap and the global M2 money supply gives you a forward-looking signal that cuts through the noise. It tells you when the macroeconomic tide is rising and when it is about to pull back. For a self-directed investor who understands that central bank liquidity drives risk asset prices, this ratio becomes your compass.
The Bitcoin M2 money supply ratio compares Bitcoin’s realized market cap to the global money supply (M2). A low ratio suggests room for Bitcoin to absorb liquidity and rally. A high ratio warns that Bitcoin is pricing in frothy conditions. By tracking this ratio, you can avoid buying at euphoric peaks and instead accumulate during periods of monetary expansion when Bitcoin is still cheap relative to cash.
What the Bitcoin M2 Money Supply Ratio Actually Measures
The M2 money supply includes cash, checking deposits, and near-money assets like savings accounts and money market funds. Central banks expand M2 when they print money or loosen credit conditions. When M2 grows, that new liquidity has to go somewhere. Historically, it flows into stocks, real estate, and Bitcoin.
The Bitcoin M2 ratio divides Bitcoin’s estimated realized market cap by the global M2 figure. Realized cap matters more than price times total coins because it accounts for lost or dormant coins. A ratio of 0.5% means Bitcoin represents half a percent of all the liquid money in the world. That number sounds small, but its movement over time tells you whether Bitcoin is pricing in cheaply or expensively relative to the global cash pool.
Think of it like a tide gauge. When M2 grows faster than Bitcoin’s market cap, the ratio drops. That drop signals that liquidity is being created faster than Bitcoin is absorbing it. The next wave of buying often lifts Bitcoin’s price disproportionately. When Bitcoin’s market cap grows faster than M2, the ratio rises. That rise warns that Bitcoin is getting expensive relative to available cash.
Why This Ratio Matters More Than Price Alone
Price alone is a lagging indicator. By the time you see Bitcoin at $120,000, the liquidity that drove it there might already be priced in. The M2 ratio gives you a leading signal because it compares Bitcoin to the fuel source.
Here is a breakdown of what different ratio zones have historically meant:
| Ratio Range | Signal | Suggested Stance |
|---|---|---|
| Below 0.3% | Bitcoin is cheap relative to global liquidity. M2 is expanding. | Accumulate. The runway for growth is long. |
| 0.3% to 0.6% | Neutral zone. Bitcoin is keeping pace with money creation. | Hold and monitor. Prepare for entries on dips. |
| 0.6% to 1.0% | Bitcoin is pricing in premium conditions. M2 growth may slow. | Reduce position size. Take partial profits. |
| Above 1.0% | Bitcoin is expensive relative to cash. Historically rare. | Defensive mode. Wait for M2 to catch up. |
These are not hard rules. They are guideposts. The key is watching the trajectory, not a single snapshot.
How to Calculate and Track the Ratio Yourself
You do not need a Bloomberg terminal. You can pull the data from free sources and update it monthly.
- Get the global M2 estimate. The Federal Reserve, ECB, and Bank of Japan publish M2 data quarterly. For a monthly proxy, use the sum of the top five central bank balance sheets plus a growth factor. Many macro data sites like FRED or Trading Economics offer this.
- Find Bitcoin’s realized market cap. Use CoinMetrics or Glassnode. They adjust for lost coins and entity-controlled supply. Do not use the simple price times 21 million figure. It overstates the active supply.
- Divide realized cap by global M2. Multiply by 100 to get a percentage.
- Plot the ratio on a simple line chart. Compare it to Bitcoin’s price over the same period.
- Watch for divergences. If M2 is rising and the ratio is falling, that is your accumulation window.
You can do this once a month. The ratio moves slowly. That is the point. It filters out daily noise and shows you the macro trend.
Common Mistakes When Using the M2 Ratio
Even experienced investors make errors with this metric. Here are the most frequent ones and how to avoid them.
- Using the wrong M2 figure. Some people use US M2 only. Global M2 is better because Bitcoin is a global asset. US M2 plus Eurozone and Japanese M2 covers most of the monetary base.
- Ignoring realized cap. Total supply includes coins that have not moved in over a decade. Those coins are not participating in the market. Realized cap gives you the active market value.
- Treating the ratio as a trigger. The ratio is a guide, not a buy signal. You still need to confirm with on-chain data like exchange inflows or spent output profit ratio (SOPR).
- Forgetting that M2 data lags. Central banks report with a delay. You are looking at conditions from one to three months ago. That is fine because the trends persist. Just do not expect real-time precision.
For a deeper look at on-chain confirmation signals, see our guide on how to predict Bitcoin price corrections using SOPR data.
How the Ratio Fits Into a Broader Timing Strategy
The M2 ratio works best as the top of your funnel. It tells you whether the macro environment supports a long position. Once the ratio signals a favorable zone, you drop down to shorter time frame tools.
Here is a practical workflow:
- Check the M2 ratio monthly. If it is below 0.4% and trending down, you are in an accumulation zone.
- Use exchange flow data to find the exact entry point. Look for days when exchange reserves spike and spot prices dip. Those are the sniper entries.
- Confirm with on-chain metrics like active addresses and UTXO age. Rising active addresses with old coins moving suggests accumulation.
- Size your position based on how far the ratio is from its historical ceiling. More room means larger position.
If you want to see how this fits with other on-chain signals, read our article on 5 Bitcoin on-chain metrics that signal market tops and bottoms.
A Concrete Example From the 2024-2025 Cycle
Let us walk through a recent cycle to make this real. In late 2024, global M2 was expanding at a clip of roughly 6% year over year. Bitcoin’s realized cap was around $900 billion. The M2 ratio sat near 0.35%. That was low. It told you that Bitcoin had room to grow relative to the cash being created.
By mid 2025, Bitcoin’s realized cap had risen to around $1.8 trillion. M2 had continued expanding but at a slower pace. The ratio climbed toward 0.7%. That was a warning. Bitcoin was pricing in the liquidity expansion faster than new money was being created. The sideways price action in late 2025 made sense in hindsight. The ratio was telling you that the easy liquidity had been absorbed.
If you had been watching the ratio, you would have accumulated through late 2024 and early 2025. You would have trimmed exposure by mid 2025 when the ratio crossed above 0.6%. That is the kind of timing the M2 ratio enables.
When the Ratio Gives False Signals
No single metric is perfect. The M2 ratio has blind spots.
- It does not account for Bitcoin specific catalysts like ETF approvals, halving events, or regulatory shifts. Those can compress or extend the cycle.
- It assumes M2 growth is the dominant driver. During periods of severe credit contraction or deflation, the ratio can spike even though Bitcoin is not actually expensive. You have to check the context.
- It is a macro signal. It will not help you call the exact bottom within a week. For that, you need tools like the Bitcoin MVRV ratio or exchange order book imbalance.
Use the ratio as your compass. Use other tools as your map.
Practical Steps to Start Using the Ratio Today
You do not need a complicated setup. Here is a simple monthly routine.
- Set a calendar reminder for the first week of each month.
- Open a spreadsheet with three columns: date, global M2 estimate, Bitcoin realized cap.
- Calculate the ratio and plot it on a line chart.
- Compare the current ratio to the 0.3%, 0.6%, and 1.0% thresholds.
- Write a one sentence note about the trend. Is it rising, falling, or flat?
- Adjust your position size accordingly.
If you want automated monitoring, check out our list of top tools for real-time Bitcoin price alerts and monitoring. Some of those tools can track macro indicators alongside price.
Why This Ratio Is Especially Relevant in 2026
The macroeconomic environment in 2026 is unique. Central banks in the US, Eurozone, and Japan are navigating a post inflation normalization. M2 growth has stabilized after the spike of 2020-2022 but remains positive. Meanwhile, Bitcoin’s institutional adoption through ETFs and corporate treasuries has increased its sensitivity to liquidity conditions.
The ratio is more useful now than it was in 2020 because Bitcoin’s market cap is large enough to register meaningfully against global M2. In 2020, the ratio was below 0.1%. Now it regularly trades between 0.3% and 0.8%. That means the signal is clearer. The ratio moves in bands that you can actually trade against.
For a broader look at how institutional flows affect the cycle, see our analysis on why Bitcoin ETF inflows are the new key indicator for price trends.
Putting It All Together
The Bitcoin M2 money supply ratio is not a crystal ball. It is a quantitative sanity check. It answers the question, “Is Bitcoin cheap or expensive relative to the world’s cash?” That question is more useful than, “Is Bitcoin at $100,000 or $120,000?” because price without context is just a number.
“The M2 ratio strips away the narrative and shows you the monetary reality. When the ratio is low and trending down, the macro wind is at your back. When it is high and rising, the wind is shifting. Your job is to feel that shift before the crowd does.”
Start tracking the ratio this month. Plot it alongside your portfolio. Let it guide your accumulation and your profit taking. Over time, you will develop an intuition for when Bitcoin is pricing in cheaply and when it is getting ahead of itself. That intuition is worth more than any trading bot.
For more on building a complete on-chain monitoring routine, read our guide on how retail traders can use Bitcoin on-chain data to read market cycles. Combine that with the M2 ratio, and you will have a timing edge that most retail investors overlook.