
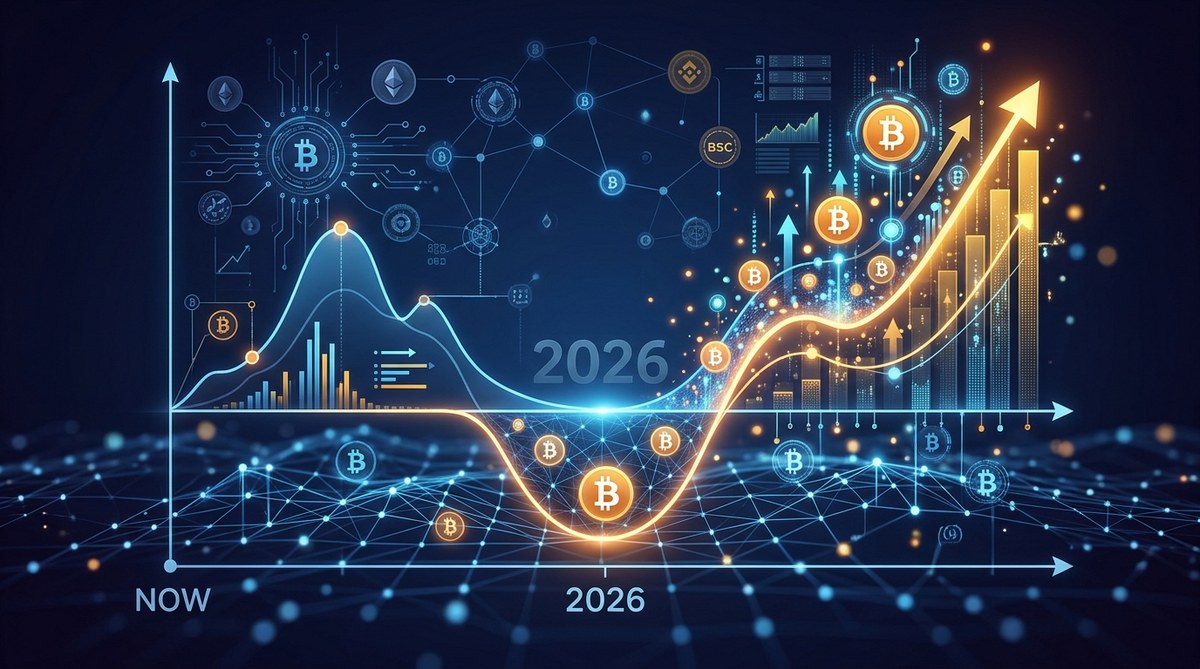
If you have been watching Bitcoin since the 2022 bear market, you know the four year rhythm by heart. Halving year, then a run up, then a peak, then a pullback. That pattern has held for three full cycles. But 2026 feels different. Price action is muted. The usual post halving euphoria never fully materialized. Instead of a blow off top, we are seeing sideways chop, low volatility, and a slow bleed of retail attention. This is not a broken cycle. This is the dormancy phase. And for people who understand how Bitcoin really moves, this is the most important moment to pay attention.
Bitcoin’s 2026 dormancy phase is not a sign of weakness. It is the natural re accumulation period that follows every halving cycle. On chain data shows that long term holders are stacking coins while short term speculators exit. The next accumulation window is opening right now. Investors who study metrics like exchange flow, MVRV ratio, and spent output ratio can identify the exact zones where smart money is building positions before the next bull run.
Why the 2026 Dormancy Phase Feels Uncomfortable
Every cycle has a boring chapter. In 2014, Bitcoin drifted from $900 down to $200 and stayed there for months. In 2018, the market bled from $17,000 to $3,200 and then sat flat. Those periods felt hopeless at the time. But they were actually the foundation for the next explosive move.
The 2026 dormancy phase shares the same DNA. The difference is that the macro backdrop is noisier. ETF flows, institutional balance sheets, and geopolitical headlines create a fog that makes it hard to see the underlying accumulation pattern. Retail traders get distracted by the noise. They look at a flat chart and assume the opportunity is gone.
But the on chain story tells a different truth.
What the On Chain Data Reveals About Accumulation
When price goes quiet, you have to look at what coins are doing. Are they moving to exchanges to sell? Or are they moving to cold storage to hold?
Here are the three on chain signals that define the 2026 accumulation window:
- Exchange reserve drawdowns: Coins leaving exchanges and going into private wallets is a classic accumulation signal. When exchange balances fall while price stays flat, it means buyers are absorbing supply.
- Spent output ratio (SOPR) compression: SOPR measures whether coins are moving at a profit or a loss. A compressed SOPR near or below 1.0 tells you that sellers are capitulating and buyers are stepping in.
- MVRV ratio decline toward accumulation zones: The MVRV ratio compares market value to realized value. When it drops below 1.5, history suggests you are in a macro accumulation zone.
If you want to go deeper into these signals, check out our guide on how to analyze bitcoin market cycles for better investment timing.
A Practical Process to Read the 2026 Cycle
You do not need a Bloomberg terminal to spot the window. You just need a repeatable process.
- Check exchange flow data weekly. Look at the net flow from exchanges to private wallets. If the trend is negative for four consecutive weeks, accumulation is underway.
- Plot the MVRV ratio on a chart. Anything below 1.8 is historically a buy zone. Below 1.2 is a deep accumulation zone.
- Monitor the spent output ratio. A SOPR reading below 1.0 for two weeks straight suggests sellers are exhausted.
- Cross reference with the Puell multiple. The Puell multiple compares daily issuance to the 365 day average. A reading below 0.7 has historically marked the bottom of bear markets.
- Set price alerts at key on chain levels. Use the realized price (the average cost basis of all coins) as your floor. Buying near that level has worked in every previous cycle.
For a full breakdown of these metrics, read our article on 5 bitcoin on chain metrics that signal market tops and bottoms.
Common Mistakes During the Dormancy Phase
| Mistake | Why It Hurts | Better Approach |
|---|---|---|
| Chasing altcoins for a dopamine hit | Altcoins bleed value faster in bear phases | Stick with bitcoin until the macro trend flips |
| Selling because of media negativity | Headlines lag the on chain reality | Use data, not sentiment |
| Waiting for a clear breakout confirmation | You miss the bottom by 30 to 50 percent | Accumulate when metrics say accumulation, not when price says rally |
| Ignoring fee spikes | High fees during quiet price usually means network activity | Check mempool data for unusual congestion |
Why Institutional Flow Does Not Kill the Cycle
A common argument in 2026 is that institutions have smoothed out the four year cycle. The reasoning goes that ETF inflows and corporate treasury allocations create a permanent bid that eliminates the deep bear markets.
But look at the data. ETF inflows in early 2026 were strong in January and February, then tapered off. Institutional buying is not a straight line. It follows its own sentiment cycle. When institutions pull back, the market still needs organic demand to push price higher. That organic demand builds during dormancy.
The cycle is not dead. It has just become more nuanced. On chain metrics are even more valuable now because they cut through the institutional noise.
“The best time to accumulate Bitcoin is when everyone else is bored with it. The 2026 dormancy phase is that moment. On chain data confirms that the smartest wallets are stacking while the headlines scream uncertainty.”
How to Time Your Entry Using the 2026 Accumulation Window
You do not need to catch the exact bottom. You need to catch the window. The window opens when multiple on chain metrics align.
Here is a table that maps the key metrics to their ideal reading during accumulation:
| Metric | Accumulation Reading | What It Indicates |
|---|---|---|
| Exchange net flow | Negative for 30+ days | Coins leaving exchanges for cold storage |
| MVRV ratio | Below 1.5 | Market value below macro fair value |
| SOPR | Below 1.0 | Sellers are losing or breaking even |
| Puell multiple | Below 0.8 | Issuance is cheap relative to historical average |
| Realized cap growth | Flat or rising slowly | Network value is accumulating without price mania |
If you see three or more of these readings at the same time, you are in the accumulation window. That is your signal to start building a position.
For a deeper look at how realized cap works, read our piece on how to use bitcoin’s realized cap to spot long term entry points.
The Role of Whale Behavior in 2026
Whales do not buy at the top. They buy at the bottom and during the boring middle. In 2026, whale wallets that went dormant in 2024 and 2025 have started moving again. But they are not moving to exchanges. They are moving to new wallets, consolidating UTXOs, and preparing for the next leg up.
You can track this using coin days destroyed (CDD). CDD measures how long coins sit still before they move. When CDD spikes, it means old coins are waking up. That is not a sell signal. It is a rebalancing signal. Whales are reorganizing their stacks for the next cycle.
If you want to monitor whale movements directly, our guide on 7 bitcoin whale wallet movements that preceded the last 3 major rallies walks through the patterns.
Why the 2026 Cycle Requires Patience Over Speed
The biggest edge you have as an individual investor is time. Institutions have to report quarterly. Funds have to show returns. You do not have those constraints.
The 2026 dormancy phase rewards patience. You do not need to be the first one in. You need to be consistent. Accumulate when the on chain data says the window is open. Hold through the chop. Wait for the macro trend to turn.
This is not about timing a single entry. It is about building a position over weeks and months while the market is asleep.
Using the Stock to Flow Model as a Confidence Check
The stock to flow model compares the existing supply of Bitcoin to the new supply entering the market. After the 2024 halving, the flow rate dropped by half. That means the stock to flow ratio doubled. In theory, that should create upward price pressure over time.
But in practice, the market needs demand to catch up with supply scarcity. That catch up happens during the dormancy phase. The stock to flow model is not a timing tool. It is a conviction tool. When you feel uncertain about whether accumulation makes sense, look at the stock to flow ratio. It reminds you that the supply side is structurally bullish.
For a full walkthrough of this model, see how to use bitcoin’s stock to flow model for 2026 price projections.
The Next Accumulation Window Is Already Open
You do not need to wait for a perfect bottom. The 2026 dormancy phase has already created the conditions for accumulation. On chain data shows exchange balances declining, MVRV sitting in the low zone, and SOPR flirting with bear market readings.
The question is not whether the window will open. It is whether you will recognize it while it is still open.
Start monitoring the metrics we covered. Set up a simple dashboard with exchange flow, MVRV, and SOPR. Check it once a week. When the signals align, act.
The boring moments in Bitcoin are always the ones that separate the people who understand cycles from the people who chase headlines. The 2026 dormancy phase is your boring moment. Use it.